Brightwork Energy
An annual report where every chart comes with its own table
A cooperative's annual report, rebuilt as a short printed edition and a data site where members can check every number and download the figures behind it.
- Client
- Brightwork Energy
- Year
- 2025
- Services
- Editorial design, data visualisation, web
- Team
- 2 designers, 1 developer, 1 editor
- Timeline
- 10 weeks
The brief
Brightwork is a cooperative that owns nine wind and solar sites in the north of the Netherlands, with 18,400 members who each hold at least one share. Every spring it publishes an annual report ahead of the general meeting. In 2024 that report was 84 pages, printed in 20,000 copies and posted to every member. The board suspected few people read it, and the members who did read it complained that the charts were hard to check.
The brief was to make a report that members would actually use at the meeting, and to stop printing quite so many.
What we did
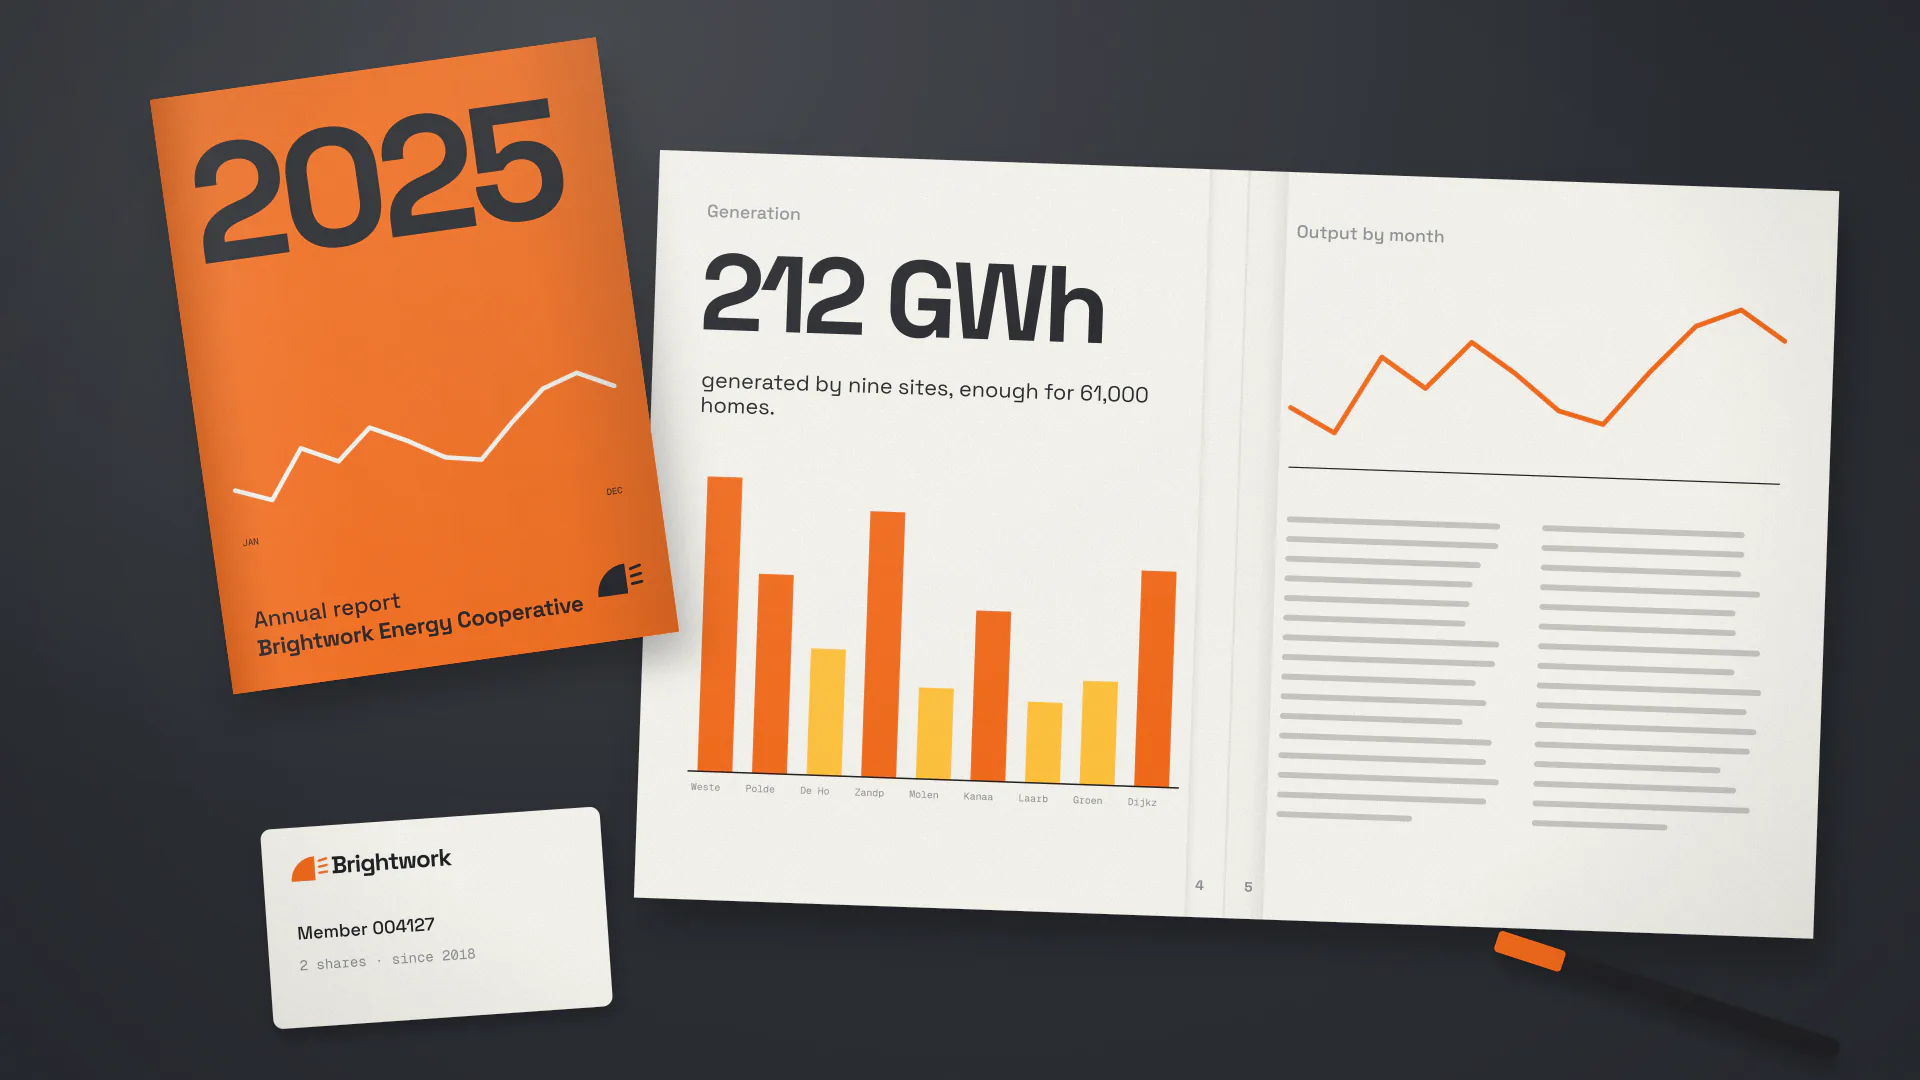
We split the report in two. A short printed edition covers the year in 32 pages: what the sites produced, what members earned, what changed and what the board proposes. Everything else, including all the figures, lives on a report website.
The rule for the site was simple: no chart without its numbers. Every chart has the table it was drawn from directly below it, with a CSV download. The charts themselves are plain:
- bar and line charts only, with the values labelled where there is room
- one colour for Brightwork’s own figures and grey for comparisons
- the same scale for the same measure across every page
- a sentence above each chart saying what it shows, written before the chart was drawn
The site is static and built from the finance team’s spreadsheets. We wrote a small importer that turns each sheet into a table and a chart, so a correction in the spreadsheet updates both. Ten weeks was tight, and we spent a good part of it with the finance team agreeing which figures were final and when.
Print was the other decision. Instead of posting every member a copy, Brightwork asked members in January whether they wanted one. About 6,000 said yes.
What changed
The print run fell from 20,000 to 6,000, which paid for most of the project. The report site had a median visit of a little over four minutes, and 1,900 members downloaded at least one table, usually the one about their share returns.
Questions at the general meeting shifted, too. The board reported fewer questions about where a number came from and more about what to do next, which is what a general meeting is for.
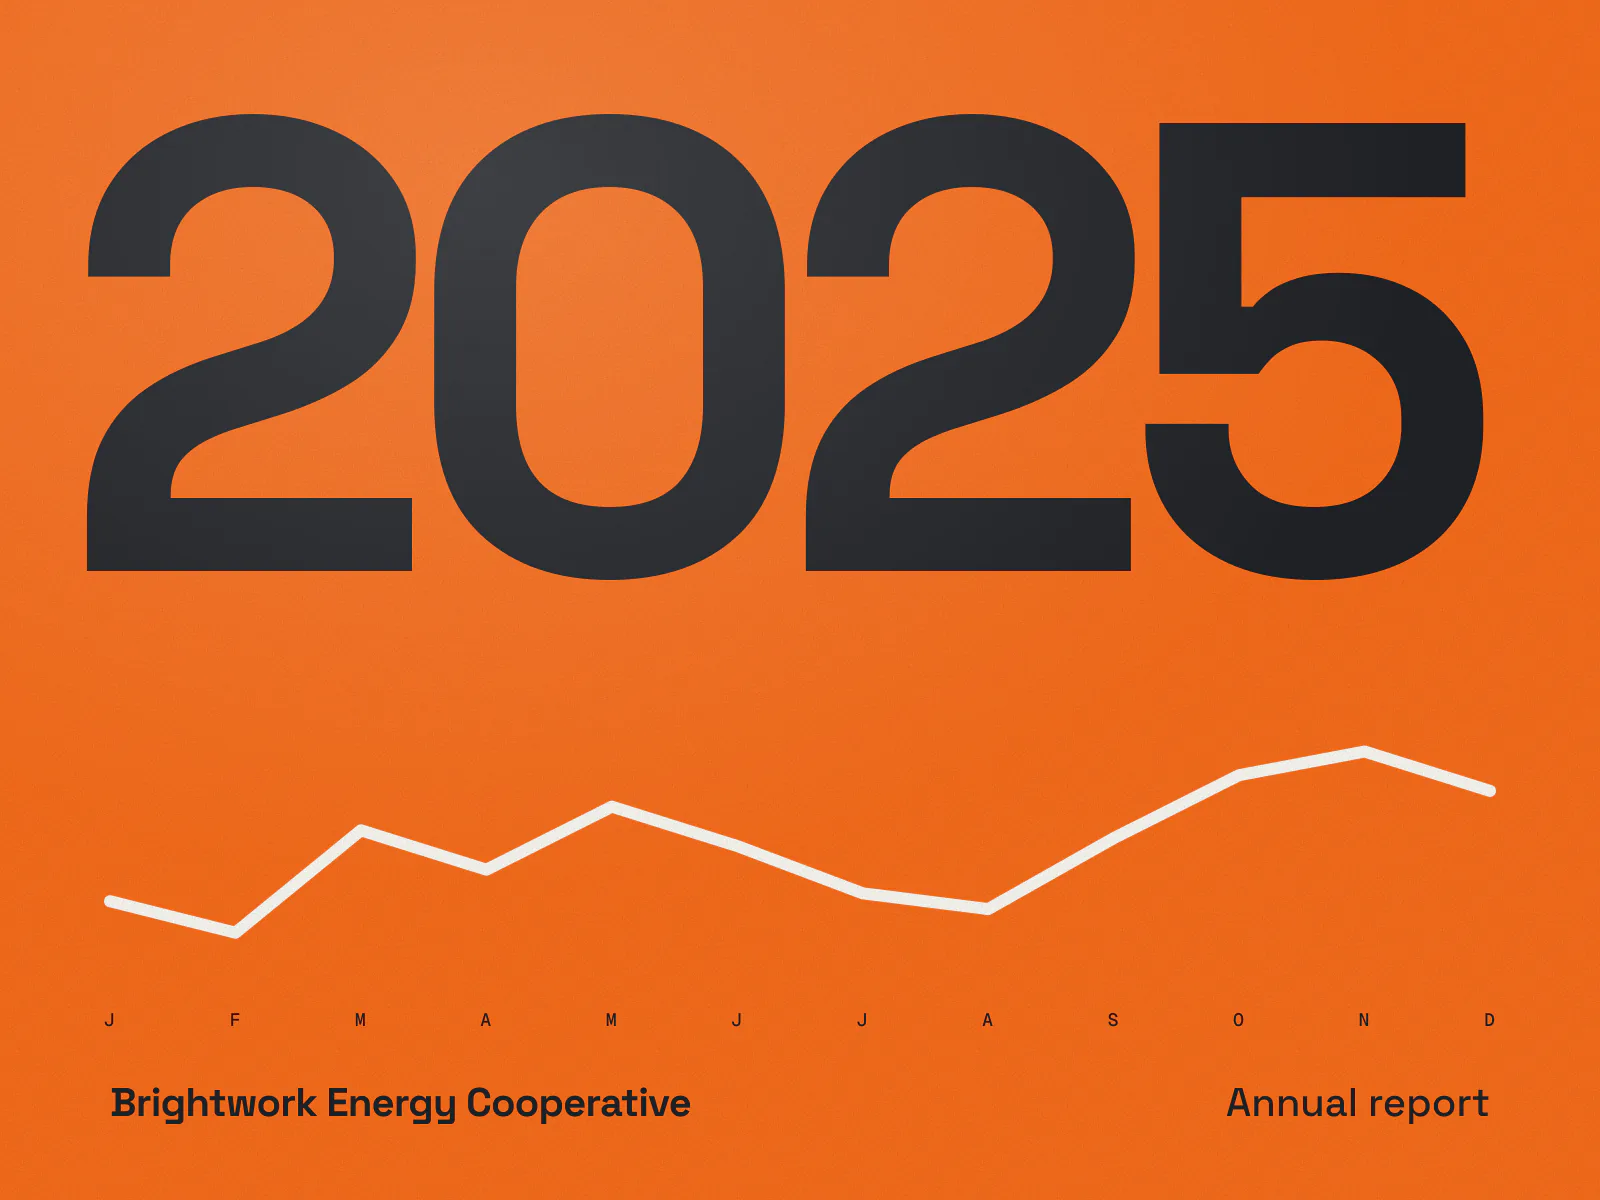
The cover carries one chart, the cooperative's output by month, and nothing else. 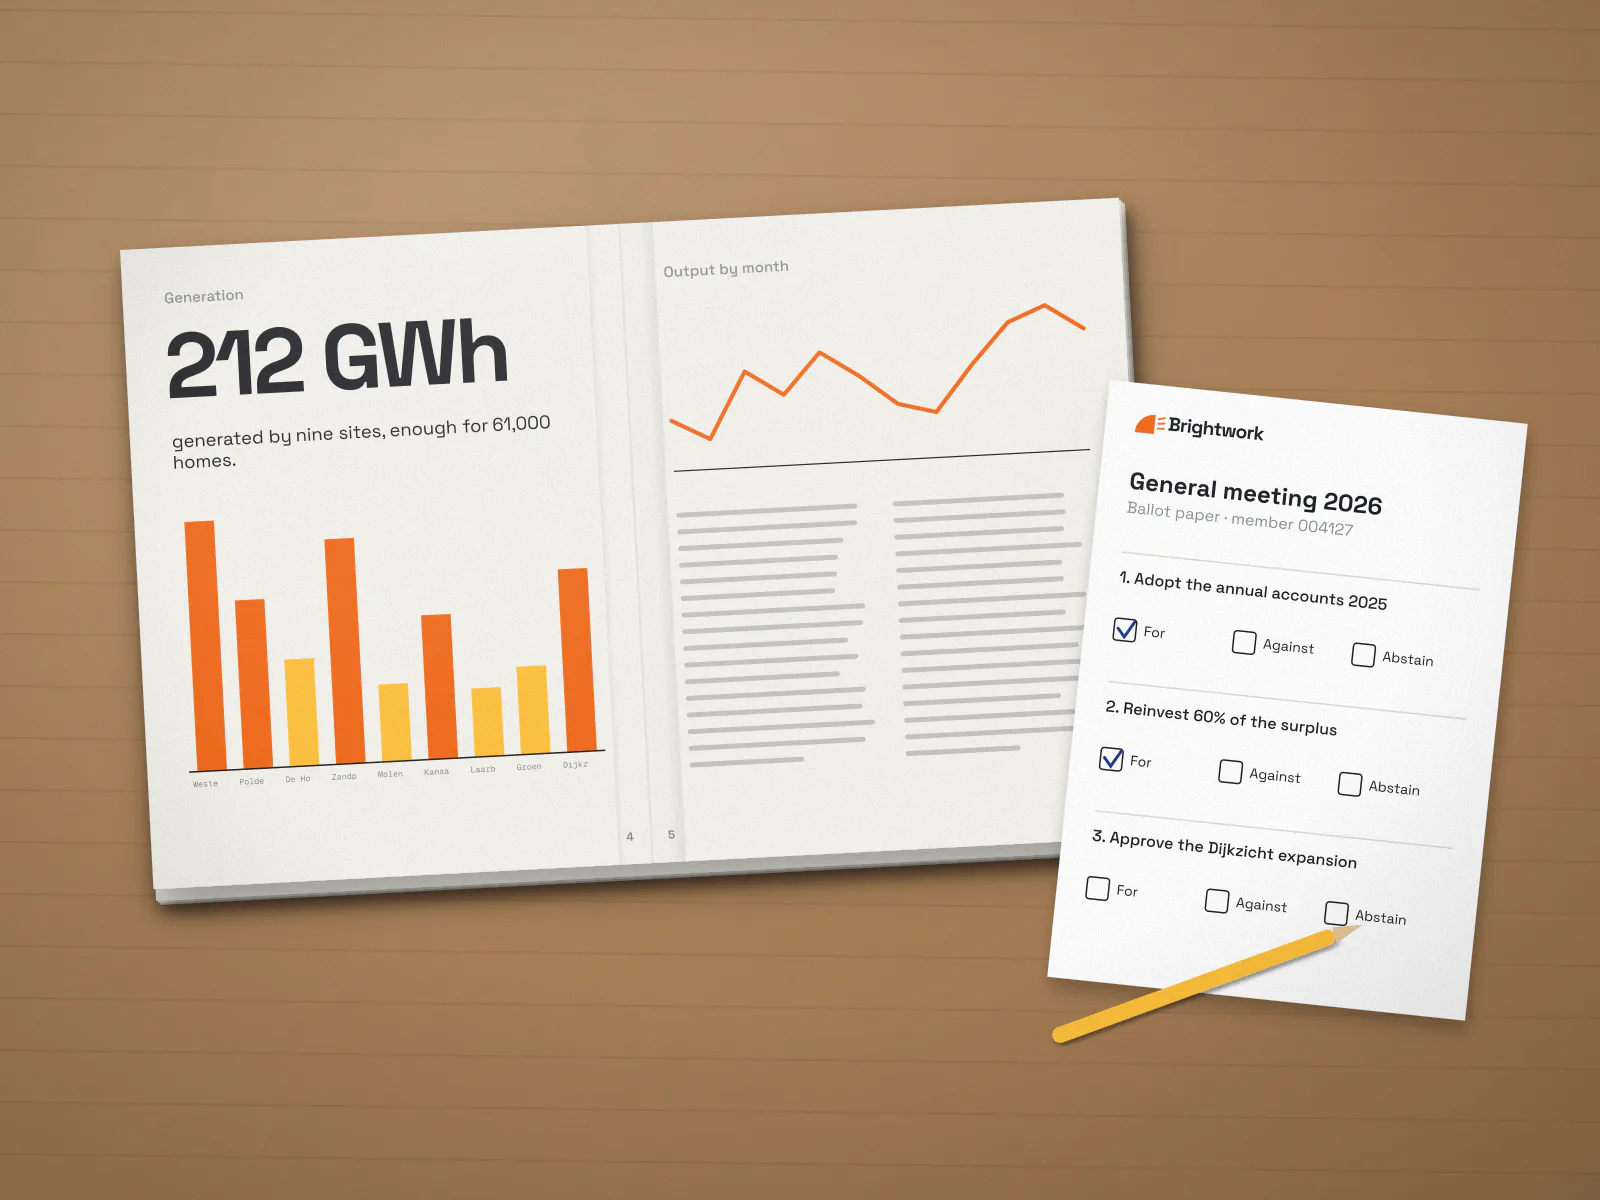
The printed edition is 32 pages, down from 84, and goes only to members who ask for it. 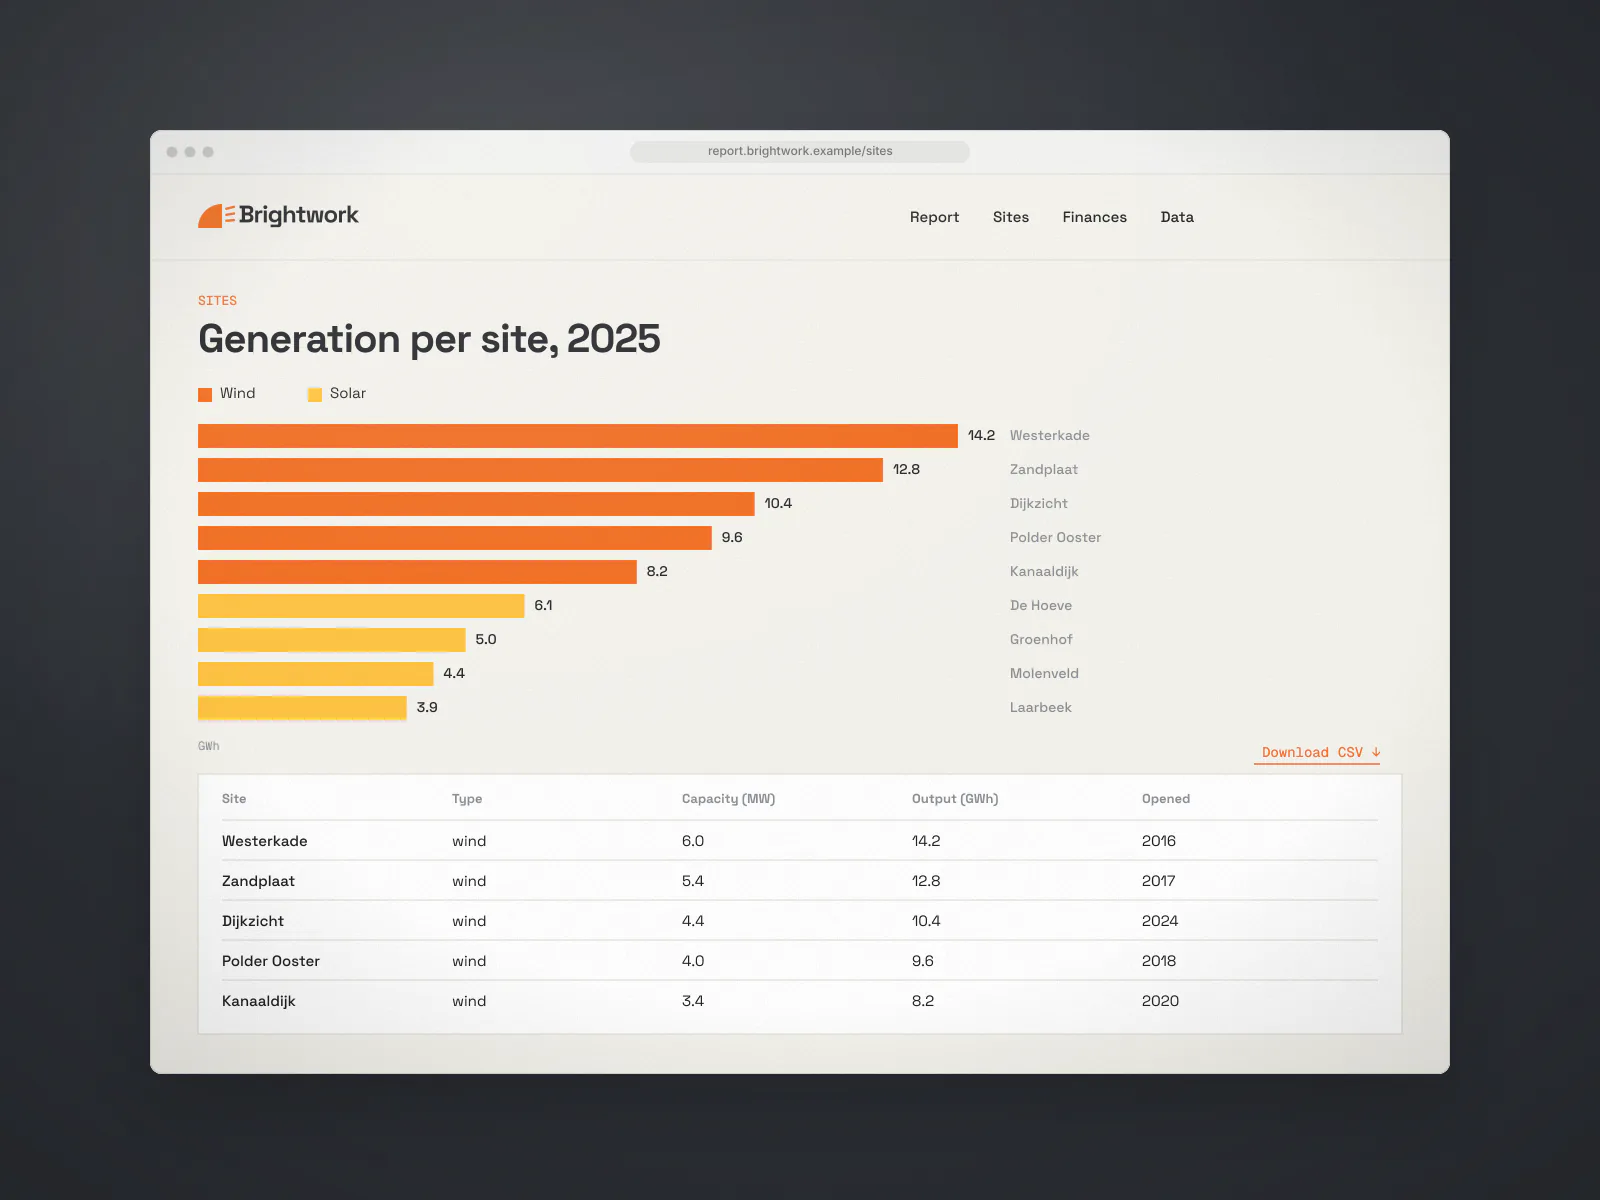
Every chart on the site has its table directly below it and a CSV link. 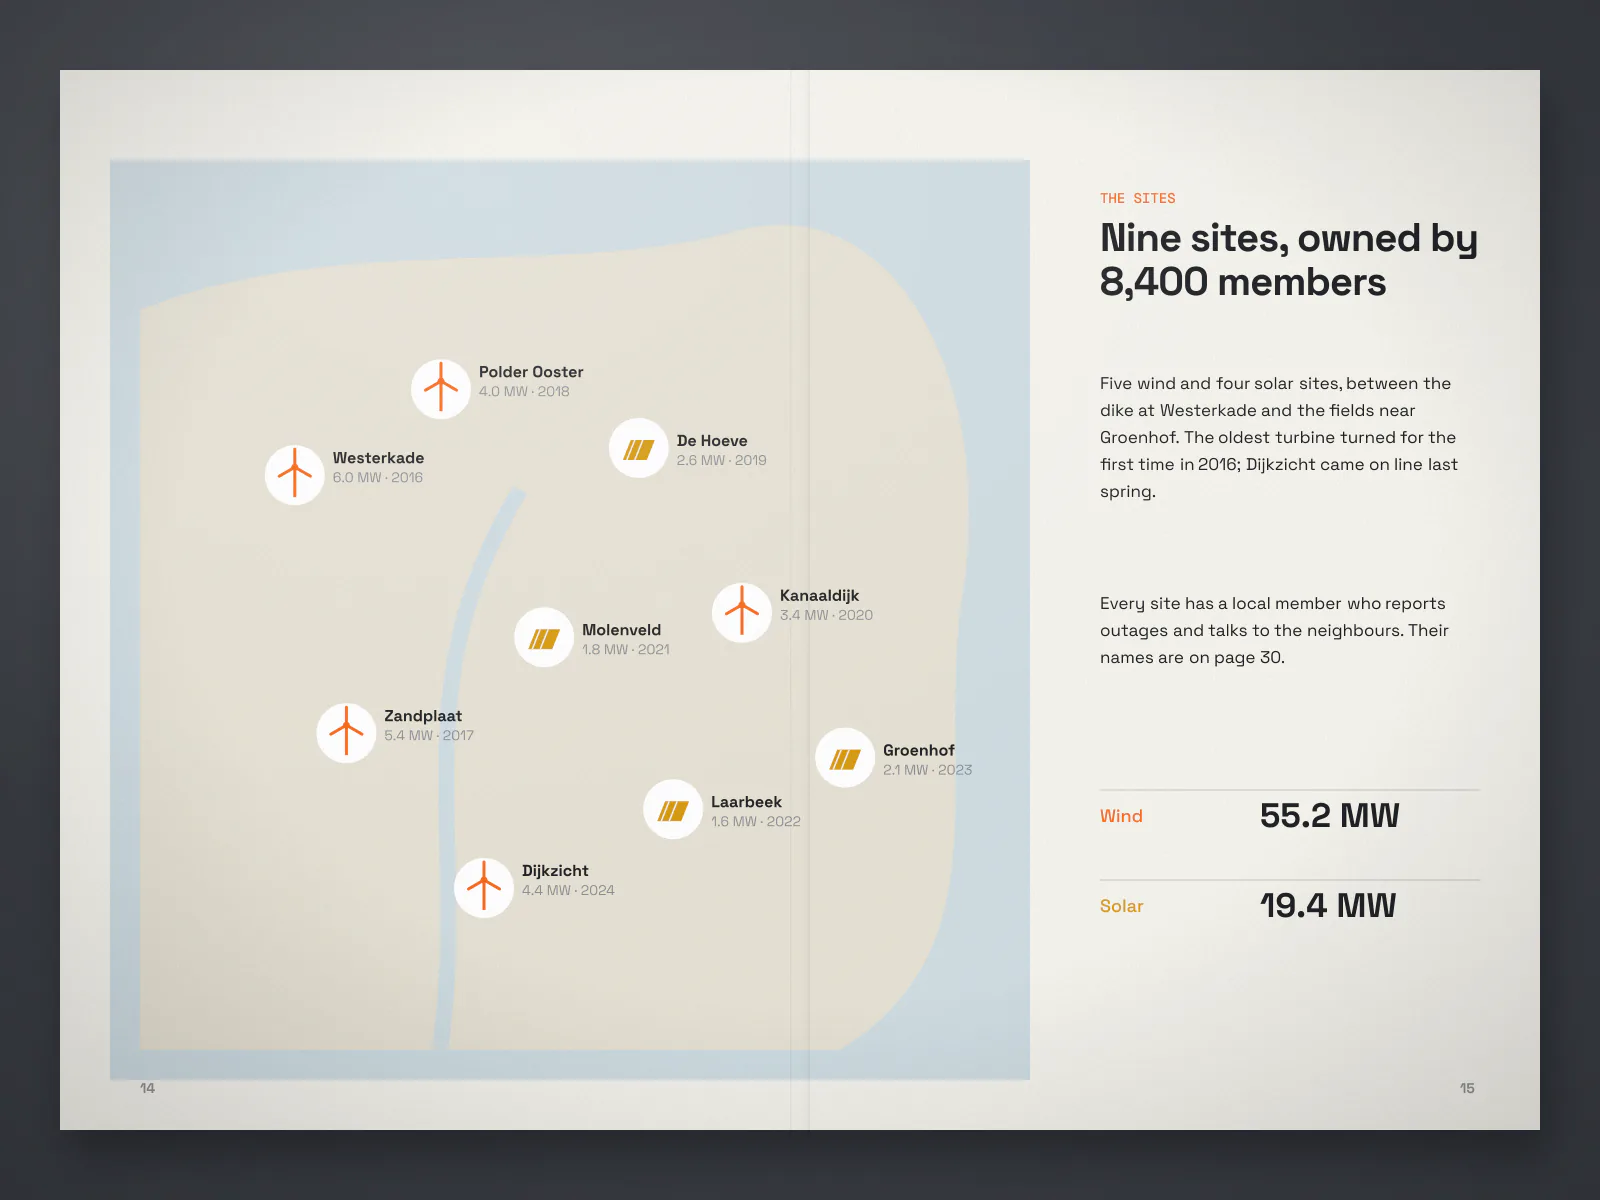
The sites spread: nine wind and solar sites with capacity, output and the year each one opened.
What changed, in numbers
- printed copies, by sending print only to members who asked
- −70%
- median time on the report site
- 4m 10s
- members downloaded at least one data table
- 1,900
“Our members own the turbines, so they ask hard questions about the numbers. This year they could check every chart against the table underneath it. The general meeting was the calmest we've had.”